UI Design Process:
Dashboard Chart
Small chart showing project labor costs for small businesses (QuickBooks Online)
In this week-long special project, I explored initial designs for a QuickBooks Online dashboard widget that would calculate projected final labor costs for small businesses trying to plan for payroll.
I responded to that feedback and came up with a final design that was accepted for release to the QuickBooks main dashboard.
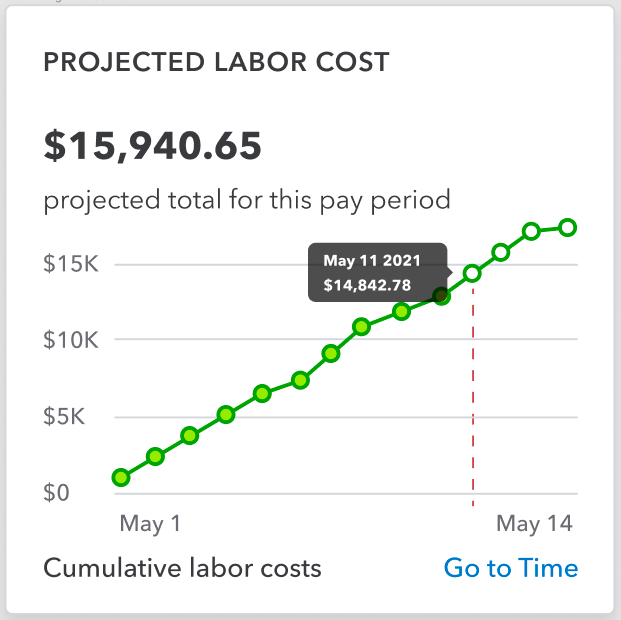
After moving forward with a simplified line-chart layout instead of the more visually complex column chart, I gathered feedback on how to make it fit alongside other widgets in a dashboard seen by 100,000+ customers per day.